- Regional Support Office for Asia and the Pacific (RSOAP)
- Member States in Asia and the Pacific
- SUSTAINABLE TOURISM OBSERVATORIES (INSTO)


World Tourism Barometer: January 2024
International Tourism to end 2023 close to 90% of Pre-pandemic levels

According to the first UNWTO World Tourism Barometer of the year, international tourism ended 2023 at 88% of pre-pandemic levels , with an estimated 1.3 billion international arrivals . The unleashing of remaining pent-up demand, increased air connectivity, and a stronger recovery of Asian markets and destinations, are expected to underpin a full recovery by the end of 2024 (UNWTO Tourism Barometer January 2024 – Press Release) .
An estimated 1286 million international tourists (overnight visitors) were recorded around the world in 2023, an increase of 34% over 2022. International tourism recovered 88% of pre-pandemic levels, supported by strong pent-up demand (UNWTO Tourism Barometer January 2024-Excerpt) .
International tourism is expected to fully recover pre-pandemic levels in 2024, with initial estimates pointing to 2% growth above 2019 levels. This central forecast by UNWTO remains subject to the pace of recovery in Asia and to the evolution of existing economic and geopolitical downside risks (UNWTO Tourism Barometer January 2024 – Press Release) .
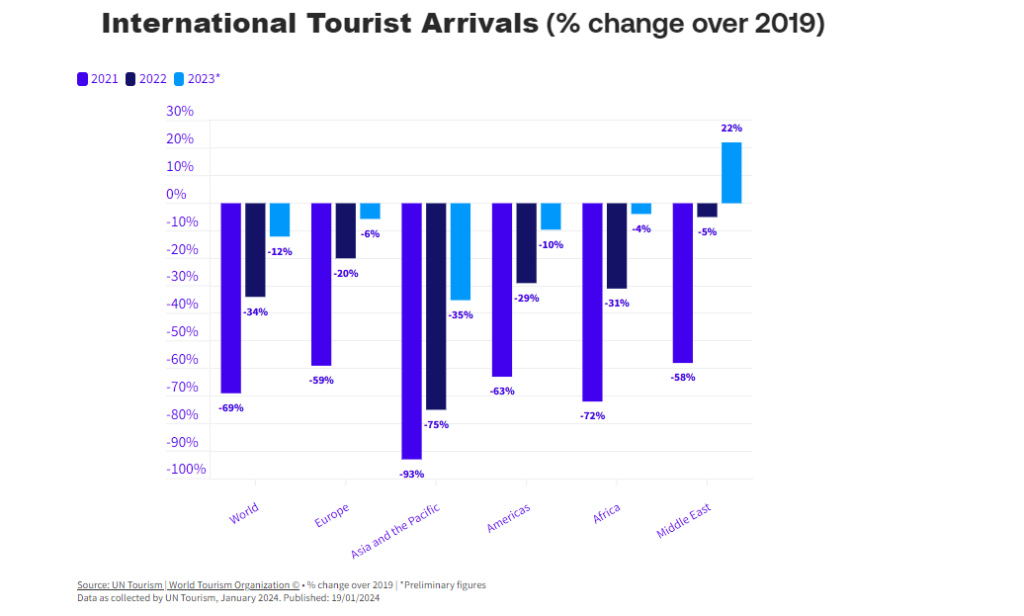
Asia and the Pacific reached 65% of pre-pandemic levels, with a gradual recovery since the start of 2023 following the reopening of several markets and destinations. However, performance among subregions were mixed, with South Asia recovering 87% of pre-pandemic levels and North-East Asia, 55% (UNWTO Tourism Barometer January 2024-Excerpt) .
There is still significant room for recovery across Asia. The recent reopening of several source markets and destinations is expected to boost recovery in the region and globally (UNWTO Tourism Barometer January 2024- Excerpt) .
Read more on the UNWTO Tourism Barometer (January 2024 excerpt) here .
About the UNWTO World Tourism Barometer
The UNWTO World Tourism Barometer is a publication of the World Tourism Organization (UNWTO) that monitors short-term tourism trends regularly to provide global tourism stakeholders with up-to-date analysis of international tourism. The information is updated several times a year and includes an analysis of the latest data on tourism destinations (inbound tourism) and source markets (outbound tourism). The Barometer also includes three times a year Confidence Index based on the UNWTO Panel of Tourism Experts survey, which provides an evaluation of recent performance and short-term prospects for international tourism.
Regional Support Office in Asia and the Pacific (RSOAP)
Rsoap a to z.
- Sustainable Tourism Observatories(INSTO)
UNWTO A to Z
- About UNWTO
- Affiliate Members
- Member States
- Tourism in the 2030 Agenda
- World Tourism Day
- Technical Cooperation
- ASIA AND THE PACIFIC
- MIDDLE EAST
- RESOURCES/SERVICES
- Sustainable Development of Tourism
- Ethics, Culture and Social Responsibility
- Market Intelligence
- Tourism Data Dashboard
- Publications
- UNWTO Academy
Partners links

© UNWTO Regional Support Office for Asia and the Pacific (RSOAP)

Download WP Travel
Please enter your email to download WP Travel and also get amazing WP Travel offers and Newsletters.
Currently the form is not available.
Global Tourism Statistics 2024:Facts and Forecasts
Home » Blog » Global Tourism Statistics 2024:Facts and Forecasts
After the massive hit of the COVID-19 pandemic, global tourism’s future and trends tend to move towards an upward shift. This paradigm shift has a gigantic impact on tourism and related activities. So, we will delve more into Global Tourism Statistics 2024:Facts and Forecasts today.
There was a subsequent rise in GDP after the COVID-19 pandemic period . Statista predicted in 2022 that the tourism industry will get back on track as tourists tend to be inbound and outbound from place to place.
Table of contents
Global tourism analysis, global tourism statistics 2019, global tourism statistics 2020, global tourism statistics 2021, global tourism statistics 2022, global tourism statistics 2023, global tourism statistics 2024 | predictive analysis, international tourist arrivals in 2024.
- Global Tourism Contributions to GDP 2024
Global Tourism Growth Rate 2024
Global tourism revenue growth rate 2024.
The tourism industry and activities started to flourish after the pandemic. The number started to rise again. Global Tourism Statistics predicted that the travel and tourism business will experience 18% growth in 2024.
This is the highest point after the pandemic period. Hotel bookings, travel, and tourism businesses are expected to reach new heights. Experts suggest it’s the best time to start your own travel agency business.
- International tourist arrivals worldwide were around 95,000 at the beginning of 2019.
- The growth rate of tourist arrivals was slower.
- Nearly $1.9 trillion was spent by tourists in 2019.
- Travel receipts were around $9.3 billion in 2019.
Global Tourism was about $8.9 trillion in 2019 . Tourists love to explore beautiful countries. And popular destinations. France tends to hold the Number 1 position in 2019 as more than 90 million tourists visit the country.

(Top 5 visited countries 2019)
Moreover, 2019 tourism was slightly disturbed by covid 19 from July. However, there were many popular destinations loved by tourists worldwide.
In 2019, the total spending on world tourism reached a peak of $1.86 trillion, showing a growth of 1.81% compared to the previous year.
This indicates that people tend to spend more on travel and tourism activities, contributing to the overall tourism industry’s economic enhancement.
The increase in spending suggests a continued interest and investment in tourism experiences on a global scale.
There was a massive decline in the travel and tourism industry in 2020. The tourism industry declined by more than 67% compared to the previous year . This makes one of the greatest downward shifts in the tourism industry ever recorded after subsequent time.
Pacific island Fiji tends to face an economic crisis because of a decline in tourist and tourism activities. Countries relying totally on tourism were more affected this year.
From January to May 2020. International tourist arrivals declined by more than 56% similarly in April it was recorded with a decline of 97%.

(Decline in international arrivals 2019 vs 2022)
The limited movement of people from place to place results in a massive loss for the aviation industry as well.
Air passenger was reduced by almost 60.2% compared to 2019 . This creates the worst conditions for the airline industry. Among many industries airline industry was one of the most impacted as there was a decline in tourist flow.
- GDP of tourism ( 2.9 of GDP) $624.7 billion was declined to $356.8 (1.7 of GDP) making it the greatest downfall of all time in tourism history.
- Total number of visitors in 2020 was comparatively low compared with the past 10 years of data.
- Tourism-dependent countries faced a major economic crisis.
Overall global tourism in 2020 didn’t grow that well the unpredictable circumstance has resulted in a massive decline in the GPD as well. There were approximately 1.5 billion tourist arrivals in 2019 and the number declined by more than 75% in 2020 the estimated tourist arrival in 2020 was around 381 million only. Compared with the 2019 tourist arrival the data fluctuation is very high.
The Tourism industry has gone through numerous uptrends and downtrends throughout the period. 2019 ended and 2020 was considered one of the most challenging years for the whole tourism industry. Regarding 2021 the tourism industry starts to rise at a minimal speed.
In 2021 tourism industry start to gain speed at a minimal rate according to the popular data analytical site Statista. Global tourism worldwide increased by 4% in 2021 compared to 2020.
Matter of fact the international tourist arrival was 79% down compared with the 2019 tourist inbound data.
Recovering from the mass decline of 2020 the tourism industry started to increase with several 64.4% in 2021. The travel and tourism increment number in 2020 was only 50.7%

(Decline in international tourist arrivals)
In 2021, the US had 22.1 million inbound arrivals, which is a 15% increase from 2020 and a 72% decrease from 2019.
- Overall increment in the tourism industry was recorded at more than 64.4 %
- Export revenues from international tourism dropped 59%.
- In 2021, the travel and tourism industry’s share of GDP increased from 1.54% in 2020 to 2.15% in 2021.
- Compared to 2019 the contribution of GDP was still down in 2021 ( 49.1% ) only.
- Recovering from the pandemic travel and tourism businesses tend to increase by more than 362 billion dollars.
Regarding 2021 tourism status it has shown a little increment in terms of number compared with the 2020 data. The industry recorded a substantial 64.4% growth , surpassing the incremental rate in 2020.
Export revenues dropped by 59%, while the industry’s share of GDP improved from 1.54% in 2020 to 2.15% in 2021 . Despite signs of recovery, the sector has not reached its growth level in 2020.
Comparing the tourism condition with the year 2021 the number and data start to shift toward an upward curve. Analyzing the data deeply in 2022 total international tourism receipt reached the threshold of $1 trillion which is massive compared to the 2022 number.
However, the total receipts were still not able to reach the number of pre-pandemic. In 2022 more than 900 million tourists travel internationally.
International tourist spending reached 64% of pre-pandemic levels. 2022 start to maintain sort of momentum to reach the peak point of travel and tourism activities.

( C ontribution over GDP from 2019 to 2022 )
- The total earned export revenue was still below the line ( 34 % ) below the pre-pandemic level.
- $7.7 trillion contribution to global GDP
- Significant growth in spending of international visitors ( about 20.4% increment )
- In 2022 travel and tourism generated more than 22 million new jobs . Significantly high in number compared to 2021 data.
The travel and tourism sector ultimately makes a contribution of 7.7 trillion dollars to global gross domestic product ( GDP ). The number is shifting in an upward trend compared with other previous years.
The 2022 travel and tourism activities maintained a pace of recovery mode. The industry maintained to level up from the previous year. As it intends to create more jobs and contribute more to the global economy and GDP.
All the dimensions of the tourism industry in 2022 starts to evolve and grow over time. Ultimately the revenue received from tourists hit a whopping $1 trillion and more than 900 million people travel globally.
The travel industry solely created millions of jobs and contributed to overall economic growth.
Popular website for travel and tourism data stated that more than 975 million tourists were traveling internationally in the year 2023. Compared with 2021 and 2022 this year seems to be beneficial for travel and tourism industries.
In the first quarter of 2023, there is a spike in the growth of tourist arrivals. International tourist arrival reached 80% of pre-pandemic level. This states that the year 2023 is a sort of recovery year for the tourism industry. After years the industry was able to reach this point.
The travel and tourism industry somehow was able to reach progress similar to the year 2019. Travel bookings were up r oughly 31% at the end of March 2023 compared to the same time in 2019.
The travel and tourism health progress up to 87% in the year 2023. The USA tends to be a prime actor as it was able to accumulate more than $190.39 billion U.S. dollars.
Followed by the supreme country China and Canada.
China accumulated around $154.02 billion U.S. dollars followed by Canada which is $16 billion U.S. dollars.
The total gap between Canada and the USA is around $174.39 billion U.S. dollars respectively. In terms of numbers, these countries seem to do well in the tourism industry.

(Top 5 Visited Countries 2023 )
Key Points:
- Over 975 million tourists traveled worldwide in 2023 ( Jan to Sep)
- The total projected contribution of travel and tourism was around $2.2 trillion U.S. dollars toward global GDP.
- The total international receipt projected in 2023 was around USD 1.4 trillion .
- Compared with other years in 2023, there were more than 171 nights spent compared to 2022.
- Rise in tourist traveling rate results into increment in increment in hotel occupancy rate up to 10% higher compared to the previous year.
Airline industries also tend to bounce back as revenues reach more than $803 billion , Comparatively it’s higher than 2022 as it reached around 9.7%.
Certain external factors do impact the travel business globally. The economic sanctions on Russia by different nations have resulted in delays in travel and tourism as well. Similarly, the zero COVID strategy promulgated by China has also affected the tourism industry overall.
The momentum of global tourism could potentially shift to an upward curve if all external factors don’t interrupt travel and tourism activities.
2024 is regarded as one of the important years for the travel and tourism sector. As the impact of COVID-19 started to overcome the travel and tourism business all across the world started to gain momentum throughout the time.
There are thorough predictions made for 2024 tourism. Multiple analyses tend to show potential opportunities for the tourism sector. From 2019 to 2023 the industry of tourism was scattered by COVID-19 after the interference of COVID-19 the cycle of 2024 tourism got into rollercoaster rides.
However, global tourism spending is predicted to reach $2 trillion in 2024 . After a long period, it’s predicted that international travel trips will exceed pre-pandemic levels in 2024, marking a 3% increase from 2019 .
The overall tourism market will get to a new level. The prediction is that the travel and tourism market will reach $927.30 billion in 2024 . Which is one of the big numbers compared to the previous year’s global tourism statistics.
After lot’s of ups and downs finally the travel and tourism industry is getting into momentum. It’s expected that tourist arrivals in 2024 will increase by 17.23% from the past year i.e. 2023. If the industry can meet the expectation there will be massive changes in the overall tourism business.
- The expected international tourists is about 1.53 billion which is significantly large compared to the previous year.
- the GDP contribution by tourism in 2024 will be 10.6%
- Year-to-year growth in 2024 will be increased by a large number as expectation of over 17.24 % is made.
- Ultimately the revenue will be around US 9.4 billion American dollars .
In 2024, the travel and tourism industry is on the rise after facing challenges. There’s a big anticipation of a 17.23% increase in tourist arrivals compared to 2023.

(International Tourist Arrival in 2024 )
If this expectation is met, it could bring significant positive changes to the overall tourism business.
The projected number of international tourists for 2024 is a substantial 1.53 billion, a noteworthy increase from the previous year.
The industry’s contribution to the global GDP in 2023 was 10.6%. Looking ahead, there’s an optimistic year-to-year growth forecast of over 17.24% in 2024.
In terms of revenue, the industry is expected to generate around US $9.4 billion . These promising figures indicate a strong recovery and growth for the travel and tourism sector in the coming year.
Global Tourism Contributions to GDP 2024
The travel and tourism industry is getting on track after facing challenges in recent years. For 2024, there is an optimistic growth outlook:
- Tourist arrivals are expected to increase by 17.23% from 2023 . If this matches the expectations, it could bring major positive impacts for the overall tourism business.
- International tourist projections sit at a substantial 1.53 billion for 2024, a significant jump from the previous year’s numbers.
- The industry contributed 10.6% to global GDP in 2023.
- For 2024, year-over-year growth forecasts are a promising 17.24%, indicating strong momentum.
- In terms of revenue generation, the travel sector could reach around USD 9.4 billion.

(2024 Global Tourism Contribution To GDP)
These numbers and projections point to a rapid recovery and expansion period for international and domestic travel over the coming year.
More people are expected to take vacations and business trips that could greatly benefit tour operators, hotels, airlines, and other travel entities after facing struggles not too long ago.
If the above expectations and forecasts are fulfilled, 2024 is shaping up to be a beneficial year for travel and tourism when looking at tourist arrivals, GDP contributions, growth percentages, and total revenue creation. There seems to be renewed optimism across the sector.
Overall ,the travel and tourism industry holds a positive growth approach in 2024 according to projections:
- Global tourism saw significant declines in 2020 and 2021 due to the COVID-19 pandemic. However, momentum picked back up in 2022.
- For 2023, the estimated growth rate in global tourism is between 30% to 35% as the industry rebounds.
- Looking ahead to 2024 , the global tourism growth rate is forecasted to be around 34.7%.
- This would represent a noticeable jump from the expected 30-35% growth in 2023 showing sustained positive momentum.
- If 2024 hits the projected 34.7% in tourism growth , it would take global travel significantly above 2019 volumes indicating a full industry comeback has been achieved.
- This global growth also implies strong performance in major tourism markets across different regions like Europe, Asia Pacific, the Americas, the Middle East, and Africa.

(Global Tourism Growth Rate 2024)
Ultimately, 2024 is setting up to be another very high growth year for travel globally with expectations of over one-third increase in tourism versus 2023 numbers.
So, we suggest that travel business owners be ready to create travel booking websites and generate revenue and growth substantially with huge scope.
All signals point to a sector that has recovered to pre-pandemic strength and managed to undo the large drops observed in 2020 and 2021.
International tourist arrivals are projected to reach 1.53 billion, representing a substantial recovery with an expected year-over-year growth of 17.24% from the 975 million arrivals in 2023.
After facing major challenges in 2020 and 2021, the tourism industry is all set for substantial revenue growth in 2024:
- Global tourism revenue saw a major decline of nearly 50% at the peak of the pandemic. This significantly impacted many travel businesses and destinations.
- A rebound is already underway in 2022 and is expected to continue accelerating through 2023 with an estimated 30-35% growth rate .
- Experts expect Global tourism revenues to surge by around 34.7% year-over-year in 2024
- Gaining a 34.7% revenue growth target would indicate tourism has fully recovered from the pandemic demand shock and is expanding rapidly again.

(Global Tourism Revenue Growth 2024)
If achieved, 2024 would likely represent the highest-ever revenues for the tourism industry globally surpassing pre-pandemic levels.
The projections for a nearly 35% boost in tourism revenues globally paint an extremely optimistic picture of what lies ahead for the sector in 2024 as demand swells.
This rapid growth trajectory beyond 2023 forecasts shows tourism maintaining great momentum as a key recovery success story among industries worldwide.
➤ Here is the complete list of tour operator software.
The overview for tourism in 2024 is highly positive across expected metrics. Forecasts predict that international tourist arrivals will hit 1.5 billion, representing a rapid 17.23% increase compared to estimates from 2023. This surge will elevate volumes well beyond pre-pandemic levels.
The tourism sector’s contribution to global GDP looks to have a significant rise in 2024, building on its 10.6% share in 2023. This growth reflects the sector’s full economic recovery. Most notably, tourism revenues could grow up to 34.7% year-over-year, reaching around $9.4 billion globally .

Yam Bahadur Chhetri is a content writer and vivid contributor to the WordPress community and a WordPress enthusiast with an experience of 7+ years in the relative field. He also loves to develop WordPress Themes, Plugins, and custom WordPress development for clients.
Leave a Reply Cancel reply
Your email address will not be published. Required fields are marked *
Save my name, email, and website in this browser for the next time I comment.
Get WP Travel Pro
Create Stunning , SEO friendly and Fully functional Travel website within minutes . No Coding Required !
Suitable for any
- Travel Agency
- Tour Booking Services
- Travel Bloggers
Drive more Sales and Revenues from today !
$ 99 99 USD per year

📢 Santa has sent the gift for Christmas and New Year sales on all WP Travel Pro plans. 🛍️ Use coupon code "XMAS_NEWYEAR2024" at checkout.
Related posts

How to add an automatic currency converter in WordPress

12 Business Career Jobs if You Love to Travel( Pays Good Perks)

What is a Travel Agency? Types, Purpose, Function, Services
Wp travel modules.
Need more features to save your time and to boost your travel business? WP Travel Pro comes with more powerful modules . While our core travel plugin provides almost all the features that a travel and trekking websites generally needs, our add-ons boost it’s capacity further to make it the best travel engine on WordPress. Whether you want to add new payment method to your site or brush up your trekking listings with beautiful maps show casing your trips, we have all your imagination covered. See all our add ons below to boost your travel website’s features further.

Weather Forecast

Import Export

Partial Payment
Connect with wp travel to join the travel conversation, documentation →.
Explore More
Customer Support →
We are here to help.
Facebook Group →
User Community Forum
Follow On Twitter →
Connect with us on Twitter
Tourist Arrivals Forecast 2024/2025
Trading economics provides data for 20 million economic indicators from 196 countries including actual values, consensus figures, forecasts, historical time series and news. tourist arrivals forecast 2024/2025 - was last updated on tuesday, june 18, 2024., trade, markets, gdp, labour, prices, money, government, business, consumer, housing.
Forecasting International Tourist Arrivals from Major Countries to Thailand
- Conference paper
- First Online: 17 December 2019
- Cite this conference paper

- Ontheera Hwandee 36 &
- Naragain Phumchusri 36
Part of the book series: Lecture Notes in Electrical Engineering ((LNEE,volume 619))
650 Accesses
1 Citations
Tourism industry is one of the most important industries for Thai economy. This paper proposes and compares forecasting models for international tourism arrivals to Thailand. Since country-specific forecasting models can reflect the uniqueness of each country of origin, major countries for Thai tourism, namely China, Malaysia, Korea, Japan, and Russia are explored. The data used in this research is the number of international tourist arrivals from those countries recorded monthly from Jan 2013 to Sep 2018. The performance of the Seasonal Autoregressive Integrated Moving Average model (SARIMA) and the multiple regression model are evaluated in terms of Mean Absolute Percentage Error (MAPE). Several important economic factors such as income, price, exchange rate, and qualitative factors, represented by dummy variables of seasonal effect are explored to understand their effects on international tourism demand. The results show that the SARIMA is preferred to forecast international tourism arrivals from Malaysia, while multiple regression provides lowest errors for other interested countries.
This is a preview of subscription content, log in via an institution to check access.
Access this chapter
- Available as PDF
- Read on any device
- Instant download
- Own it forever
- Available as EPUB and PDF
- Compact, lightweight edition
- Dispatched in 3 to 5 business days
- Free shipping worldwide - see info
- Durable hardcover edition
Tax calculation will be finalised at checkout
Purchases are for personal use only
Institutional subscriptions
On the Estimation of Western Countries’ Tourism Demand for Thailand Taking into Account of Possible Structural Changes Leading to a Better Prediction

Forecasting and Estimation of Medical Tourism Demand in India

Studying the Influence of Tourism Flow on Foreign Exchange Rate by IABC and Time-Series Models
Sookmark S (2011) An analysis of international tourism demand in Thailand, School of Development Economics (2011)
Google Scholar
International Monetary Fund (2018) Gross domestic product of Thailand
Lim C (1997) Review of international tourism demand models. Ann Tour Res 24:835–849
Article Google Scholar
Lim C, Mcaleer M (2002) Time series forecasts of international travel demand for Australia. Tourism Management, 389–396
Untong A, Ramos V, Kaosaard M, Reymaquieira J (2015) Tourism demand analysis of Chinese arrivals in Thailand. Tourism Economics 6:1221–1234
Song H, Li G, Witt S (2010) Tourism demand modelling and forecasting: how should demand be measured. Tour Econ 1:63–81
Salman AK (2013) Estimating tourism demand through cointegration analysis. Curr Issues Tour 6:323–338
Lim C (2004) The major determinants of korean outbound travel to Australia. Math Comput Simul 64:477–485
Article MathSciNet Google Scholar
Dritsakis N (2004) Cointegration analysis of german and british tourism demand for Greece. Tour Manag 25:111–119
Kah J, Lee SH (2013) The value of Japanese Yen and Japanese tourism in Korea. Int J Digit Content Technol Its Appl (JDCTA) 7:302–306
Agiomirgianakis G, Serenis D, Tsounis N (2015) Effects of exchange rate volatility on tourist flows into Iceland. Procedia Econ Financ 24:25–34
Hanafiah M, Harun M (2010) Tourism demand in Malaysia: a cross-sectional pool time-series analysis. Int J Trade 1:80–83
Lean HH, Chong SH, Hooy CW (2014) Tourism and economic growth: comparing Malaysia and Singapore. Int J Econ Manag 8:139–157
Box G, Jenkins GM (1970) Time series analysis, forecasting and control
Chan F, Lim C, McAleer M (2005) Modelling multivariate international tourism demand and volatility. Tour Manag 26:459–471
Song H, Stephen F, Ang G (2003) Modelling and forecasting the demand for Thai tourism. Tour Econ 4:363–387
Hao J, Var T, Chon J (2003) A forecasting model of tourist arrivals from major markets to Thailand. Tour Anal 8:33–45
Boonaom N (2018) Forecasting the number of chinese tourists in Thailand. Thammasat J 26
Luckana S, Sunee T, Yupin, K, Boonying S (2014) A forecasting methods for the number of international tourists in Thailand: box-jenkins method and winter’s method. University of the Thai Chamber of Commerce
Download references
Author information
Authors and affiliations.
Department of Industrial Engineering, Chulalongkorn University, Bangkok, Thailand
Ontheera Hwandee & Naragain Phumchusri
You can also search for this author in PubMed Google Scholar
Corresponding author
Correspondence to Ontheera Hwandee .
Editor information
Editors and affiliations.
Melaka, Malaysia
Zahriladha Zakaria
Rabiah Ahmad
Rights and permissions
Reprints and permissions
Copyright information
© 2020 Springer Nature Singapore Pte Ltd.
About this paper
Cite this paper.
Hwandee, O., Phumchusri, N. (2020). Forecasting International Tourist Arrivals from Major Countries to Thailand. In: Zakaria, Z., Ahmad, R. (eds) Advances in Electronics Engineering. Lecture Notes in Electrical Engineering, vol 619. Springer, Singapore. https://doi.org/10.1007/978-981-15-1289-6_11
Download citation
DOI : https://doi.org/10.1007/978-981-15-1289-6_11
Published : 17 December 2019
Publisher Name : Springer, Singapore
Print ISBN : 978-981-15-1288-9
Online ISBN : 978-981-15-1289-6
eBook Packages : Engineering Engineering (R0)
Share this paper
Anyone you share the following link with will be able to read this content:
Sorry, a shareable link is not currently available for this article.
Provided by the Springer Nature SharedIt content-sharing initiative
- Publish with us
Policies and ethics
- Find a journal
- Track your research
- Home
Tourism is one of the major contributors to foreign exchange earnings to Zambia and world economy. Annual International tourist arrivals in Zambia from 1995 to 2014 are considered in this paper. In this study we evaluated the model performance of Auto-Regressive Integrated Moving Average (ARIMA) and Holt Winters exponential smoothing (HWES). The error indicators: Mean percentage error (MPE), Mean absolute error (MAE), Mean absolute scaled error (MASE), Root-mean-square error (RMSE) and Mean absolute percentage error (MAPE) showed that HWES is an appropriate model with reasonable forecast accuracy. The HWES (α = 1, β = 0.1246865) showed smallest error than those of the ARIMA (0, 1, 2) models. Hence, the HWES (α = 1, β = 0.1246865) can be used to model annual international tourist arrivals in Zambia. Further, forecasting results give a gradual increase in annual international tourist arrivals of about 42% by 2024. Accurate forecasts are key to new investors and Policymakers. The Zambian government should use such forecasts in formulating policies and making strategies that will promote the tourism industry.
Zambia , International Tourist Arrivals , Holt-Winters Model , ARIMA , Forecasting
Share and Cite:
1. Introduction
Tourism is one of the major contributors to foreign exchange earnings for Zambia and other countries worldwide. According to [1] an international tourist (overnight visitor) is an individual who travels to a country other than that in which they reside for a period not exceeding 12 months and whose main purpose in visiting is other than an remunerated activity within the country visited. Data collection methods for arrivals vary from one country to another. In some countries data are from border statistics. In other countries data are from tourism accommodation establishments. Tourist data refer to the number of arrivals, not to the number of people traveling. Thus a person who makes several travels to a country during a given period is counted each time as a new arrival. Tourism contributes highly to GDP, increasing the employment rate, source of revenue for local people, private sector, public sectors and government [2] . The significance of tourism has encouraged the authors to study the number of international tourist arrivals and attempt to make more accurate forecasting for future planning.
Zambia’s tourist attraction includes 20 National Parks and 34 Game Management Areas (GMAs) with a total of 23 million hectares of land devoted to spectacular wildlife. Zambia has a rich array of traditional cultural festivities and events, including: Kuomboka Ceremony, Nc’wala Ceremony, Umutomboko Ceremony and LikumbiLya Mize Ceremony. One of the Seven Natural Wonders of the World is the Victoria Falls. The Falls plunge into the Zambezi River at about 550,000 cubic meters per second. The impact is so big such that falling water raises a cloud of vapor that can be seen more than 30 kilometers away. The fall has been known for centuries as Mosi-Oa-Tunya, meaning “The Smoke That Thunders” and it lie in the country’s tourist capital called Livingstone, south of Zambia. It was declared a World Heritage Site for its unique geological/geomorphologic significance. Other water includes the Kalambo Falls, Ntumbachushi Falls, Ngonye Falls and the Chishimba Fall [3] .
2. Literature Review
Studies by [2] were based on forecasting tourist arrival in Kenya using statistical time series modeling techniques. They used Double Exponential Smoothing and the Auto-Regressive Integrated Moving Average (ARIMA). They stated that forecasting is very important in making future decisions such as ordering replenishment for an inventory system or increasing the capacity of the available staff in order to meet expected future service delivery. Error measures such as MAPE and the RMSE were obtained in order to determine best model. Their results showed that the Double Exponential Smoothing model was the best to forecast tourists’ arrival in Kenya as both its MAPE and RMSE values were least compared to those of ARIMA (1, 1, 1).
Studies by [4] involved applying a number of time series models to analyze Australia tourist arrivals. The models include: The Granger and impulse response analyses related to VAR model, ARIMA model and the theoretical model based on Butler. The models were calibrated using Australian tourist arrival data (1956-2010). The modified Butler model predicted growth of around 7.2 million arrivals in 2015. The ARIMA (2, 2, 2) model improved the predictions and predicted a value of 6,016,012 in 2015. The actual value is well within the 95% range of 5,168,866 - 6,863,157. That is, a 95% range of arrival numbers predicted to lie within the range 5,618,866 to 6,863,157 for 2015. Hence the ARIMA (2, 2, 2) model gave best results. Further, they reported that a two-way causality between the tourist in Australia, Europe and World exists, while impulse response indicated different effect patterns, where tourist arrivals increase in the first period and declines in the second period but experience seasonal fluctuations in the third period.
Studies by [5] produced forecasts of international tourist arrival to Thailand during 2006-2010 using two methods: Structural and Trend Extrapolation Models. The Structural Model involved VAR model, GMM method, ARCH-GARCH method, ARCH-GARCH-M method, TARCH method, EGARCH method and PARCH method. The Trend Extrapolation Model involved Holt-winter method, ARIMA method, SARIMA method and Neural Network method. Structural Models gave SARIMA (0, 1, 1) (0, 1, 4) method as the best because of its low MAPE value. Trend Extrapolation Models gave VAR method because of its low MAPE value. SARIMA (0, 1, 1) (0, 1, 4) and VAR method predicted 15700656.00 million and 15985416.00 million in 2010 respectively. It was also concluded that the Thailand government tourism sector and private tourism industry sector should prepare adequately for a much more increase in number of international tourism arrival to Thailand during 2006-2010. They suggested an increase in the number of hotel, the number transportation, new tourism place, more unit of tourism polices, much more problem environment impact on tourism place, airport unit, budget for developing new tourism places and human training in tourism industry.
According to [6] , tourism is a key sector and contributes significantly to foreign exchange earnings. Earnings from tourism in Kenya increased annually from Kenya Shillings 24.3 billion in 2001 to 73.7 billion in 2010. The number increased from 1,146,102 in the year 2003 to 1,822,885 in the year 2011. Major tourist attraction in Kenya includes: Nairobi, Beach, Mombasa, Coast Hinterland, Masailand, Nyanza basin. Tourism in Kenya boosts other industries like hotel and accommodation. Results in this paper also show that in order to improve tourism, a model that can give accurate forecast results is required so that hotel industry players can respond in good time to the anticipated changes in demand over time and also maximize returns on investments. The authors used the Box-Jenkins models to generate a forecasting model using quarterly data on bed occupancy by tourists visiting Kenya from 1974 to 2011. The SARIMA (1, 1, 2) (1, 1, 1) [5] was the best fit model for forecasting future quarterly demand on tourist accommodation in Kenya. They further concluded that this model should be used in forecasting future demands and maximize their returns on investment.
The study of [7] used a number of time series models of tourist arrivals and ARIMA (2, 2, 2) model was the best fit than logistic model. The models were calibrated using Australian tourist arrival data (1956-2010). The ARIMA (2, 2, 2) model predicted more accurately for the year 2010 with a value of 6,016,012 in 2015. The actual value was well within the 95% range of 5,168,866 - 6,863,157. That is, a 95% range of arrival numbers predicted lie within the range 5,618,866 to 6,863,157 for 2015. The results of the analysis also show close relationship between the tourist numbers recorded for Europe, Australia and the World even though Australia’s tourist arrives are very low in actual terms when compared to the other numbers of tourists. The logistic model was compared with ARIMA model and the ARIMA performed better in terms of the prediction for 2010.
The study by [8] involved forecasting international tourists footfalls in India using univariate time series forecasting models, for monthly data from Dec 1990 to Jan 2010. The forecasting performance of various models was evaluated using error measures. Also the actual and forecasted values were compared from Feb 2010 to Sept 2010. The SARIMA model performs better than other competing model for forecasting, with lowest MAPE value. They concluded that this model has an advantage over other models as it explicates autoregressive and moving average process not only for the data series but also of seasonality. Also, that the SARIMA model should be used for forecasting tourists demand in India.
A paper by [9] evaluated the forecasting performance of SARIMA, Holt Winters and Grey model for foreign tourist arrivals series in India from 2003:1 - 2015:10 using error measures. Turning point analysis and U statistic computed for SARIMA and MHW models. In addition, posterior variance ratio test to check the forecasting accuracy of Grey model was computed. Their results show that the SARIMA and MHW models outperform the other model when compared using the MAPE criterion. The forecasting performance of Grey model proved to be worse among all under MAPE and PVRT criteria. Although, it is observed that the Grey model is a better option for a de-seasonal series rather than seasonal series. However, they concluded using turning point analysis and U statistic that SARIMA and MHW are best fit models with highly forecasted accuracy and can be used in India.
A study by [10] used different time series approaches to model tourist arrivals to South Africa from its main overseas markets. Error measures where used to determine the best forecast model, these included the mean absolute percentage error (MAPE), root mean square error (RMSE) and Theill’s U. The results show that seasonal ARIMA models deliver the most accurate predictions of arrivals than any other model. They concluded that one has to acknowledge that, although accurate, this method does not consider influence of external events. And therefore its application is limited to forecasting arrivals for businesses and government in the event that there are no substantial changes in the current environment. They also suggested for further research to include econometric forecasting techniques in order to address the critique above as well as the application of the current method to other sectors of tourism industry such as the accommodation industry.
3. Methodology
3.1. Holt-Winters Exponential Smoothing Model (HWES)
Holt-Winters exponential smoothing method is appropriate for forecasting non seasonal time series data. It is an extension of Simple Exponential Smoothing method and uses a linear combination of the previous values of a series for generating and modeling future values. It is applicable to time series data that has trend. Initial estimates and the slope of the trend are key to forecasting. The model for time series data Y t is defined as:
L t = α Y t + ( 1 − α ) ( L t − 1 + T t − 1 ) , 0 < α < 1
T t = β ( L t − L t − 1 ) + ( 1 − β ) T t − 1 , 0 < β < 1
where, α is the smoothing constant, β is the trend smoothing constants, Y t is raw data, L t is smoothed data and T t is the trend estimates.
The h-step-ahead forecast equation is Y ^ t + h = L t + h T t [9] .
The main reason of choosing HWES model in this study is because Holt-Winters exponential smoothing technique can be used to forecast data containing trend.
3.2. Autoregressive Integrated Moving Average Model ARIMA
ARIMA models known as Box-Jenkins methodology have been found to be more popular, efficient and reliable even for short term forecasting. The ARIMA model consists of the following components called the order of autoregressive (AR) model (p), differencing order (d) and the order of moving average (MA) model (q). The Box-Jenkin models are denoted by ARIMA (p, d, q). “I” implies that the process needs to undergo differencing and when the modelling is done, the results undergo an integration process to produce forecasts and estimates. The MA, AR and ARMA are defined as follows:
AR model: Y t = ∑ i = 1 p ϕ i Y t − i + ε t ,
MA model: Y t = ∑ i = 1 q θ i ε t − i , and
The combination of AR and MA gives
ARMA model: Y t = ∑ i = 1 p ϕ i Y t − i + ε t + ∑ i = 1 q θ i ε t − i
where ϕ t is the autoregressive parameter at time t, ε t is the error term at time t and θ t is the moving-average parameter at time t [9] .
The main reason of choosing ARIMA model in this study for the forecasting is because this model assumes and takes into account the non-zero autocorrelation between the successive values of the time series data.
3.3. The Error Measures for Model-Selection
There are several ways to evaluate forecasting models. The error indicators are the most used to compare how well models fit the time series. The best fit or forecasting model is one with minimal errors [9] . Forecast accuracy is measured by the difference between actual value and the forecasted value at time period t. The error indicators considered in this paper are MPE, MAE, MASE, RMSE and MAPE defined as follows in Table 1 .
4. Results and Discussion
Annual International tourist arrivals in Zambia from 1995 to 2014 are shown (see, Table 2 ).
The time series plot (see Figure 1 ) shows that the Zambian annual international tourist arrivals is non-stationary for d = 0 and stationary for d = 1.
The Holt-Winters exponential smoothing (HWES) and autoregressive integrated moving average (ARIMA) models are compared to determine the forecasting model for annual International tourist arrivals in Zambia from 1995 to 2014. HWES (α = 1, β = 0.1246865 ) model with a = 947,000.00, b = 39707.48, with error measures ME = −27309.61, RMSE = 92634.37, MAE = 71,582.83, MPE = −6.240377, MAPE = 12.24099 and MASE = 0.8586324 was considered as the best fit model (see, Table 3 ).
For ARIMA model, the procedure is achieved by considering the following
Table 1 . The error measures for model selection.
Table 2 . Statistics of international tourist arrivals in Zambia, 1995 to 2014.
Source: WTO, Yearbook of Tourism Statistics.
Figure 1 . Time plots (original series d = 0 and first order difference series d = 1).
steps: identification, model selection, parameter estimation and diagnostic check. A code in R was used to obtain a best fit model ARIMA (0, 1, 2) model that fitted the Zambian tourist arrival data. A code in R was also used to obtain the estimated coefficients for the ARIMA (0, 1, 2) model with MA(2)= −0.2195. The ARIMA (0, 1, 2) model parameters are significant with ME = 37002.01, RMSE = 85705.65, MAE = 73770.52, MPE = 6.869655, MAPE = 13.38775 and MASE = −0.2792933. The ACF plot (original series d = 0) in Figure 2 does not decay quickly indicating that the original series is non-stationary.
A code in R (version 0.99.903) was used to obtain results of residuals. The results Plots of ACF, Normal Q-Q and Histogram of Residuals for the ARIMA (0, 1, 2) analysis is shown in Figure 3 . Figure 3 shows that the model satisfies all required tests for a suitable model for Zambia’s tourist data.
The results in Table 3 show that HWES (α = 1, β = 0.1246865 ) model performed better than the ARIMA (0, 1, 2) on tourist arrivals data for Zambia on account of smaller measures of accuracy. Hence, HWES (α = 1, β = 0.1246865 ) model was selected for forecasting Zambia tourist arrivals.
5. Forecasting
Table 4 shows the forecast of Zambia tourist arrivals using the HWES (α = 1, β = 0.1246865). Ten step forecasts up to 2024 are reported with 80% and 95% confidence limits. Forecasting results show a gradual increase in annual international tourist arrivals of about 42% by 2024 (see, Figure 4 ).
6. Conclusion
Two models of univariate time-series analysis were considered in this study: HWES and ARIMA models. The best fit of the two models used in this study was picked based on the model indicating minimum errors. The HWES (α = 1, β = 0.1246865 ) showed smallest error than those of the ARIMA (0, 1, 2) models. Hence, the HWES (α = 1, β = 0.1246865 ) can be used to model annual international tourist arrivals in Zambia. Forecasting results give a gradual increase in annual international tourist arrivals of about 42% by 2024 resulting in an average growth rate of 7.6% at confidence interval 95%. Accurate forecasts are key to
Figure 2 . ACF and PACF plots (original series d = 0 and first order difference series d = 1).
Figure 3 . Plots of histogram of residuals, normal Q-Q and sample ACF for differenced series (d = 1).
Table 3 . Model diagnostics and selection.
Table 4 . Forecasts and confidence bounds using HWES.
Figure 4 . Forecasts and confidence bounds for HWES.
new investors and Policymakers. Therefore, the Zambian government should use such forecasts in formulating policies and making strategies that will promote tourism industry. Future research should go further and consider monthly and quarterly data so that seasonality models can be used. Also non-linear models such as ARCH and GARCH can be applied.
Conflicts of Interest
The authors declare no conflicts of interest.
- Articles
- Archive
- Indexing
- Aims & Scope
- Editorial Board
- For Authors
- Publication Fees
Journals Menu
- Open Special Issues
- Published Special Issues
- Special Issues Guideline
- E-Mail Alert
- OJS Subscription
- Publication Ethics & OA Statement
- Frequently Asked Questions
- Recommend to Peers
- Recommend to Library
- History Issue
Copyright © 2024 by authors and Scientific Research Publishing Inc.
This work and the related PDF file are licensed under a Creative Commons Attribution 4.0 International License .
- Journals A-Z
About SCIRP
- Publication Fees
- For Authors
- Peer-Review Issues
- Special Issues
- Manuscript Tracking System
- Subscription
- Translation & Proofreading
- Volume & Issue
- Open Access
- Publication Ethics
- Preservation
- Privacy Policy
- My View My View
- Following Following
- Saved Saved
Chinese outbound travel recovery lags due to costs, visa snags
- Medium Text

FLIP TO DOMESTIC TRAVEL

Sign up here.
Reporting by Sophie Yu in Beijing, Casey Hall in Shanghai and Lisa Barrington in Seoul; Additional reporting by Diana Mandia in Gdansk; Editing by Miyoung Kim and William Mallard
Our Standards: The Thomson Reuters Trust Principles. New Tab , opens new tab

Thomson Reuters
Casey has reported on China's consumer culture from her base in Shanghai for more than a decade, covering what Chinese consumers are buying, and the broader social and economic trends driving those consumption trends. The Australian-born journalist has lived in China since 2007.

World Chevron

Hungary not opposed to Rutte's candidacy for NATO top job anymore, Dutch media reports
Hungary has dropped its opposition to Mark Rutte as the next NATO secretary-general, Dutch media reported on Tuesday, after the outgoing Dutch prime minister and his Hungarian counterpart met on the sidelines of a EU leaders meeting in Brussels.

Money Report
Iceland wants to switch up its tourism tax to protect nature — and fight overtourism
By sam meredith,cnbc • published june 17, 2024 • updated on june 17, 2024 at 2:20 am.
- Iceland wants tourists to flock to its picturesque ice caps and lunar-like lava landscapes — but not at the expense of its residents or natural environment.
- From Amsterdam to Venice, hot spots across the globe have brought in measures to try to crack down on the negative impacts of overtourism, while retaining what is often a hugely significant source of income.
- "If we see that places are being damaged by the number of people that visit let's say at Geysir where we have the hot springs, we need to take action," Iceland Prime Minister Bjarni Benediktsson told CNBC.
Iceland wants tourists to flock to its bubbling hot springs, picturesque ice caps and lunar-like lava landscapes — but not at the expense of its residents or natural environment.
24/7 New York news stream: Watch NBC 4 free wherever you are
The tiny Nordic country known for fire and ice is not alone. From Amsterdam to Venice , hot spots across the globe have brought in measures to try to crack down on the negative impacts of overtourism , while retaining what is often a hugely significant source of income.
"We are trying still to mold the taxation system for the tourism sector for the future," Iceland's Prime Minister Bjarni Benediktsson told CNBC via videoconference.
"We would like to lean more towards a system where the user pays. As I see it, we would want to go more toward accession fees to the magnets, as we call them, around the country," Benediktsson said.
"By doing that, we could control traffic. So, at the height of demand, we could have a higher tax where we could control by amending the fees both within the day or between months, or during parts of the year. But this is still in the making."
Get Tri-state area news and weather forecasts to your inbox. Sign up for NBC New York newsletters.
Iceland's government reinstated its so-called tourism tax at the start of the year, seeking to raise funds for sustainability programs and mitigate the environmental impact of mass tourism.
The levy, which was suspended during the Covid-19 pandemic, applies a nominal fee of 600 Icelandic krona ($4.34) to hotel rooms, with varying costs also applied to campsites, mobile homes and cruise ships.

Benediktsson described his predecessor's reintroduction of the tourism tax as an "important decision" for the country. However, he says the government needs to go further to find the right balance.

Treasury yields rise ahead of May retail sales data

China launches anti-dumping probe into imported EU pork as trade tensions grow
As head of Iceland's pro-business, right-wing Independence Party, Benediktsson replaced Katrin Jakobsdóttir as prime minister in early April. He previously served as prime minister in 2017.
His second stint as the country's leader comes at a time when the country grapples with soaring interest rates, high inflation and a series of volcanic eruptions .
Late last month, a volcano in southwestern Iceland erupted for the fifth time since December , spewing lava that once again threatened the coastal town of Grindavik.
The seismic activity also forced the evacuation of one of the country's most visited sites, the Blue Lagoon geothermal spa. The lagoon has since reopened to tourists after authorities said the eruption had stabilized.
Booming tourism revenues
Iceland's tourism sector has come roaring back from a dip during the coronavirus pandemic. The country — which has a population of around 383,000 — expects to receive 2.3 million visitors this year, nearly 2.4 million in 2025 and as many as 2.5 million in 2026.
The revenue generated by tourism has been increasingly important to Iceland's economy.
Indeed, the tourism sector accounted for 8.5% of its gross domestic product in 2023, according to Statistics Iceland , citing preliminary figures of the Tourism Satellite Accounts. That's up from 7.5% in 2022 and exceeds the 8.2% average recorded during the pre-Covid period of 2016 through to 2019.

Looking ahead, Benediktsson said the government was working with its own "sustainability balance check" to develop its tourism taxation system.
"We came up with a system under which we look at certain indicators: Is nature in balance in a certain spot? Is society happy with the development? Is that on a green, yellow or red light?" Benediktsson said.
"If we see that places are being damaged by the number of people that visit let's say at Geysir where we have the hot springs, we need to take action," he added.
"Those are the things we are trying to develop, and we are trying to follow the indicators and make sure that the industry grows in good acceptance with society but also with nature."
Also on CNBC
- Used EV price cliff keeps getting steeper as car buyers reject 'premium' label
- Norway discovers Europe's largest deposit of rare earth metals
- With EVs, Honda may be North America's most committed automaker, for the moment

This article tagged under:

Putin will travel to North Korea tomorrow for a 'friendly state visit'
Posted: June 17, 2024 | Last updated: June 17, 2024

More for You
The Biden administration has finalized a controversial new retirement rule — here are 5 things you need to know now
Jayson Tatum's Luxurious Car Is Going Viral Before NBA Finals Game 5
Winter Storm Warning for Two States as 15 Inches of Snow Forecast
Ben Stiller Recalls the 'Amazing Memories' He Has of Growing Up Around His Famous Parents
8 foods you should never eat at a hotel breakfast
How to Clear Cookies from Your iPhone and Android (and Why You Should)
CNN data guru ‘speechless’ after polling finds Trump headed for ‘historic performance’ with Black voters
At 58, Elizabeth Hurley Shares Her ‘Simple’ Habits for Looking and Feeling Her Best
The Best Way To Clean That Nasty Grease Off Of Your Kitchen Cabinets
How to Do Calf Raises to Fire Up Your Leg Muscles and Improve Your Balance
Princess Anne Expertly Handles Rambunctious Horse During Trooping the Colour Parade
90s rockstar, 58, falls off stage during his guitar solo
3 Unexpected Uses For Old SD Cards
Laundry is a top source of microplastic pollution—here's how to clean your clothes more sustainably
Simone Ashley’s Sheer Take on Regency Era Style Is Actually Kind of Historically Accurate
People Are Sharing The Home Improvements That They Wish They Hadn't Done Or Would Do Differently, And I Am Taking Notes
Donald Trump's Fortunes Reversed in Two Battleground States
Caitlin Clark's Vulnerable Message on Her Mental Health Turns Heads
The most popular TV host of all time is not Johnny Carson or Dick Clark, according to fans. See the top 28.
New Netflix movie took 7 years ‘and $320,000,000’ to make
Recommended
Cold war concerns resurface as nuclear-powered russian submarine arrives in cuba.
- View Author Archive
- Get author RSS feed
Thanks for contacting us. We've received your submission.
If you thought the Cold War had returned last week , you were not daydreaming.
The Kazan , a Russian nuclear-powered submarine, and accompanying surface ships , including the frigate Admiral Gorshkov , made port in Havana, Cuba, scene of several epic Cold War crises. Both the Kazan and the Gorshkov routinely carry nuclear-capable Zirkon and Kalibr cruise missiles, although Russia denied the vessels were doing so on this trip.
The Biden administration ’s reaction was schizophrenic, some officials asserting that the deployment was entirely routine , while others said the Kazan ’s nuclear capabilities clearly made it significant . Certainly, the missile test-firings by the Kazan and the Gorshkov , conducted near Florida’s coastline, brought back memories.

Moscow’s effort to show it can still project naval power far from home occurred simultaneously with this year’s G-7 meeting in Italy. Western military aid to Ukraine to defend against Russia’s 2022 invasion and the future of that aid if Donald Trump wins in November were top-tier subjects discussed among the G-7 leaders.
In Cold War parlance, the timing of Russia’s naval maneuver was no coincidence, comrade.
In what seemed an appropriate reaction to Russia’s ploy, the USS Helena , a US nuclear-powered hunter-killer submarine , promptly turned up at Guantanamo Bay, America’s base on Cuba.
But the behind-the-scenes story looks much worse for the Biden administration. News reports indicate that, upon learning of the Kazan flotilla’s destination, the White House immediately had qualms about proceeding with an unrelated, routine, previously-scheduled deployment of a US nuclear-powered submarine to Guantanamo.
An earlier US submarine call there had raised tensions with Cuba, and Biden’s advisors reportedly fretted that having Russian and US nuclear-powered submarines at the island could increase tensions with both Russia and Cuba .

Fortunately, the Pentagon argued that altering US Navy deployments in our own backyard because of a Russian intrusion into the Americas would send exactly the wrong message to Moscow, Beijing and others.
Moreover, this Russian gambit is very likely not over. Moscow’s small flotilla could well steam across the Caribbean to Venezuela in coming days, making port calls elsewhere in the region.
If the White House knows or suspects the remainder of the Russian itinerary, it is not saying.
So, is all this serious, or just play-acting by Moscow and Washington?
Get opinions and commentary from our columnists
Subscribe to our daily Post Opinion newsletter!
Thanks for signing up!
Please provide a valid email address.
By clicking above you agree to the Terms of Use and Privacy Policy .
Never miss a story.
Vladimir Putin, for one, is not play-acting.
Russia’s unprovoked attack on Ukraine has not produced nearly the result the Kremlin expected, Russia’s economy has been damaged, and Putin’s domestic dominance in Russia shaken.
Now, however, Putin Russia has stabilized the Ukrainian battlefield, made recent, modest gains, and is strong enough internally to launch his own purges.
He sees White House bandwidth severely stretched with wars in Ukraine and the Middle East, and a tight presidential race underway. Moreover, Moscow is watching carefully to see if Biden remains deterred by his often-voiced fear of “a wider war” in Europe.

Accordingly, for Putin, now is the time to flaunt Russia’s sophisticated weaponry and its geopolitical reach, 90 miles from the Florida Keys.
The Kremlin’s show of muscle was to remind Westerners, particularly in Washington (and even Beijing’s leaders, still short on blue-water naval assets) of Moscow’s global reach.
Today, indeed, all G-7 leaders, excepting Italian Prime Minister Giorgia Meloni, are in domestic political trouble, which Moscow’s sally into the Americas helps underline.
The White House’s predictable hand-wringing and weakness exposed BIden’s worries that new foreign flare-ups and international chaos would undercut his facade of statesmanship.
In this presidential election year, the candidates should be having a serious debate about America’s proper place in the world, and what our country needs to defend its interest and values globally. Instead, we have two candidates both long past their use-by dates. This palpable lack of US international leadership is painful to watch.
Other countries see it as well, and their attitudes and expectations of Washington for the next four years are being downgraded accordingly.
John R. Bolton is a former ambassador to the United Nations and National Security Advisor.
Share this article:

Advertisement
UN Tourism | Bringing the world closer
Share this content.
- Share this article on facebook
- Share this article on twitter
- Share this article on linkedin
International Tourist Arrivals Reach 1.4 billion Two Years Ahead of Forecasts
- All Regions
- 21 Jan 2019
PR No. : PR 19003
- 2018 totalled 1.4 billion international tourist arrivals (+6%), consolidating 2017 strong results and proving to be the second strongest year since 2010
- Middle East (+10%) and Africa (+7%) grew above the world average while Asia and the Pacific and Europe grew at 6%
- For 2019, UNWTO forecasts a 3-4% increase, in line with the historical growth trend
Madrid, Spain, 21 January 2019 - International tourist arrivals grew 6% in 2018, totalling 1.4 billion according to the latest UNWTO World Tourism Barometer. UNWTO’s long term forecast issued in 2010 indicated the 1.4 billion mark would be reached in 2020, yet the remarkable growth of international arrivals in recent years has brought it two years ahead.
International tourist arrivals up 6% in 2018
UNWTO estimates that worldwide international tourist arrivals (overnight visitors) increased 6% to 1.4 billion in 2018, clearly above the 3.7% growth registered in the global economy.
In relative terms, the Middle East (+10%), Africa (+7%), Asia and the Pacific and Europe (both at +6%) led growth in 2018. Arrivals to the Americas were below the world average (+3%).
“The growth of tourism in recent years confirms that the sector is today one of the most powerful drivers of economic growth and development. It is our responsibility to manage it in a sustainable manner and translate this expansion into real benefits for all countries, and particularly, to all local communities, creating opportunities for jobs and entrepreneurship and leaving no one behind” said UNWTO Secretary-General Zurab Pololikashvili. “This is why UNWTO is focussing 2019 on education, skills and job creation.”, he added.
UNWTO’s long-term forecast published in 2010 predicted the 1.4 billion mark of international tourist arrivals for 2020. Yet stronger economic growth, more affordable air travel, technological changes, new businesses models and greater visa facilitation around the word have accelerated growth in recent years.
Results by region
International tourist arrivals in Europe reached 713 million in 2018, a notable 6% increase over an exceptionally strong 2017. Growth was driven by Southern and Mediterranean Europe (+7%), Central and Eastern Europe (+6%) and Western Europe (+6%). Results in Northern Europe were flat due to the weakness of arrivals to the United Kingdom.
Asia and the Pacific (+6%) recorded 343 million international tourist arrivals in 2018. Arrivals in South-East Asia grew 7%, followed by North-East Asia (+6%) and South Asia (+5%). Oceania showed more moderate growth at +3%.
The Americas (+3%) welcomed 217 million international arrivals in 2018, with mixed results across destinations. Growth was led by North America (+4%), and followed by South America (+3%), while Central America and the Caribbean (both -2%) reached very mixed results, the latter reflecting the impact of the September 2017 hurricanes Irma and Maria.
Data from Africa points to a 7% increase in 2018 (North Africa at +10% and Sub-Saharan +6%), reaching an estimated 67 million arrivals.
The Middle East (+10%) showed solid results last year consolidating its 2017 recovery, with international tourist arrivals reaching 64 million.
Growth expected to return to historical trends in 2019
Based on current trends, economic prospects and the UNWTO Confidence Index, UNWTO forecasts international arrivals to grow 3% to 4% next year, more in line with historic growth trends.
As a general backdrop, the stability of fuel prices tends to translate into affordable air travel while air connectivity continues to improve in many destinations, facilitating the diversification of source markets. Trends also show strong outbound travel from emerging markets, especially India and Russia but also from smaller Asian and Arab source markets.
At the same time, the global economic slowdown, the uncertainty related to the Brexit, as well as geopolitical and trade tensions may prompt a “wait and see” attitude among investors and travellers.
Overall, 2019 is expected to see the consolidation among consumers of emerging trends such as the quest for ‘travel to change and to show’, ‘the pursuit of healthy options’ such as walking, wellness and sports tourism, ‘multigenerational travel’ as a result of demographic changes and more responsible travel.
“Digitalisation, new business models, more affordable travel and societal changes are expected to continue shaping our sector, so both destination and companies need to adapt if they want to remain competitive”, added Pololikashvili.
More information is available at:
UNWTO World Tourism Barometer Homepage
UNWTO World Tourism Barometer Presentation
UNWTO Communications Department
Tel: (+34) 91 567 8100 / Fax: +34 91 567 8218 / [email protected]
Follow us on Facebook , Twitter , Instagram , YouTube , LinkedIn and Flickr .
Related Content
Kingdom of morocco wins high-level vote to host next wo..., tourism has ‘life-changing potential’ - world tourism o..., the world tourism organization and globalia launch the ..., world tourism organization general assembly opens with ....
- Asia/Pacific
- Latin America
- Middle East, Africa & Türkiye
- Shopping Cart
- IDC Media Center
- Current: IDC Forecasts Global PC Shipments to Grow 2.0% in 2024, Led by the Arrival of AI PCs and the Start of a Commercial Refresh Cycle

Publication date: 06 Mar 2024
IDC Forecasts Global PC Shipments to Grow 2.0% in 2024, Led by the Arrival of AI PCs and the Start of a Commercial Refresh Cycle
- Michael Shirer Email: [email protected] Phone number: +1 508-935-4200
- Ryan Reith Email: [email protected] Phone number: +1 508-935-4301
- Bryan Ma Email: [email protected] Phone number: +65 6829-7733
- Jay Chou Email: [email protected] Phone number: +1 650-350-6464
Copy the following code into your site
Regions Covered
Topics covered.
- AI accelerators
- Workstations
Cyprus says no let-up to fiscal discipline course as S&P raises country's credit rating to BBB+
Cyprus says it won’t let up on a course of strict fiscal discipline while supporting economically vulnerable groups and the middle class after credit ratings agency Standard & Poors upgraded the country’s rating to BBB+ from BBB
NICOSIA, Cyprus — Cyprus said Saturday it won’t let up on a course of strict fiscal discipline while supporting economically vulnerable groups and the middle class after credit ratings agency Standard & Poor’’s upgraded the country’s rating to BBB+ from BBB.
Cypriot President Nikos Christodoulides said the ratings upgrade affirms the “correctness” of his government’s economic policy of responsible fiscal policies, banking sector stability and continuous reforms.
The agency also kept the outlook for Cyprus as positive, meaning that further upgrades could be possible over the next two years if banks continue to reduce the number of bad loans that burden them — a vestige of the 2013 financial crisis — and Cyprus continues to shrink its current account deficit.
“Access to international markets and attracting foreign investments, among other things, are essential elements to keeping the Cypriot economy on a growth trajectory,” Christodoulides said in a statement.
Outlining its rationale for the upgrade, S&P said in a statement Friday that it forecasts the Cypriot economy to grow by an average of 3% of gross domestic product over the next three years.
The agency also projects the country’s debt to fall below 60% by 2027, thanks to strong fiscal surpluses averaging 2.1% of GDP over the next three years, “our strongest forecast across all 20 eurozone members.”
The agency said its upgrade is also due to Cypriot banks’ efforts to strengthen their financial position through cost-cutting initiatives and moving away from non-resident depositors following the financial crisis that drove the island nation to the brink of bankruptcy.
S&P said Cyprus’ increasingly diversified economy in recent years — including the nascent information and communications technology sector — has allowed the country to shrug off the impacts of the global pandemic, the imposition of EU sanctions against Russia following Moscow’s invasion of Ukraine in 2022 and the most recent Israel-Hamas war in Gaza.
Tourism, a key economic driver, is holding firm, with arrivals close to record levels last year.
S&P warned that it could revise the outlook on Cyprus if the country’s commitment to reducing its public debt wavers or its structural reform progress stalls, which could delay European Union funding.
The S&P upgrade comes a week after agency Fitch also raised Cyprus rating to BBB+ on the strength of the country’s heightened ability to withstand financial shocks, a commitment to fiscal discipline and a more robust banking sector.

- Travel, Tourism & Hospitality ›
Leisure Travel
Industry-specific and extensively researched technical data (partially from exclusive partnerships). A paid subscription is required for full access.
- Number of inbound tourist arrivals in Russia 2014-2022
Chinese travel behavior in Russia
Is tax-free shopping available in russia, number of inbound tourism visits to russia from 2014 to 2022 (in 1,000s).
To access all Premium Statistics, you need a paid Statista Account
- Immediate access to all statistics
- Incl. source references
- Download as PDF, XLS, PNG and PPT
Additional Information
Show sources information Show publisher information Use Ask Statista Research Service
September 2023
2014 to 2022
Inbound tourism trips (visits) are defined by the source as "a trip made by a foreign citizen (national) to the Russian Federation, over the reference period, for any main purpose (business, leisure, or other personal purpose) other than to be employed by a resident entity (enterprise) registered in the Russian Federation. Trips of foreign service staff (crews) on public mode of transport, diplomats, national diplomats, consulate personnel, military personnel and their beneficiaries should not be included in the number of inbound tourism visits."
Other statistics on the topic Travel and tourism in Russia
Travel, Tourism & Hospitality
- Countries with the highest outbound tourism expenditure worldwide 2019-2023
- Leading outbound travel destinations in Russia 2021-2022
- Number of outbound tourists from Russia 2022, by territory
- Number of outbound tourism trips from Russia 2014-2022
To download this statistic in XLS format you need a Statista Account
To download this statistic in PNG format you need a Statista Account
To download this statistic in PDF format you need a Statista Account
To download this statistic in PPT format you need a Statista Account
As a Premium user you get access to the detailed source references and background information about this statistic.
As a Premium user you get access to background information and details about the release of this statistic.
As soon as this statistic is updated, you will immediately be notified via e-mail.
… to incorporate the statistic into your presentation at any time.
You need at least a Starter Account to use this feature.
- Immediate access to statistics, forecasts & reports
- Usage and publication rights
- Download in various formats
You only have access to basic statistics. This statistic is not included in your account.
- Instant access to 1m statistics
- Download in XLS, PDF & PNG format
- Detailed references
Business Solutions including all features.
Statistics on " Travel and tourism in Russia "
- Travel industry revenue distribution in Russia 2022, by segment
- Tourism spending in Russia 2019-2022, by travel purpose
- Travel and tourism's total contribution to GDP in Russia 2019-2023
- Travel and tourism's total contribution to employment in Russia 2019-2023
- Outbound travel expenditure in Russia 2011-2022
- Outbound tourist flow growth in Russia 2022, by destination
- European Union (EU) Schengen visas issued in Russia 2010-2023
- International tourism spending in Russia 2011-2022
- Leading source markets for travel to Russia 2020-2022, by arrivals
- Domestic travel spending in Russia 2019-2022
- Number of nature protected areas in Russia 2015-2022, by type
- Estimated demand for inbound tourism in Russia Q1 2014-Q3 2023
- Inbound tourist flow growth in Russia 2020-2023
- Travel industry organizations distribution in Russia 2022, by segment
- Number of tourism companies in Russia 2010-2022
- Most popular travel websites in Russia 2023, by traffic
- Number of package tours sold in Russia 2014-2021, by type
- Value of package tours sold in Russia 2014-2022, by type
- Package tour cost in Russia 2014-2022, by type
- Most popular travel destinations on package tours in Russia 2022
- Number of domestic airline passengers in Russia monthly 2020-2022
- Passenger traffic growth of airlines in Russia 2021
- Travel transportation consumer price in Russia 2022, by type
- Paid travel accommodation services value in Russia 2015-2022
- Travel accommodation establishments in Russia 2022, by federal district
- Total room area in travel accommodation in Russia 2013-2022
- Number of visitors in hotels in Russia 2010-2022
- Number of hotel visitors in Russia 2022, by travel purpose
- Overnight accommodation cost in Moscow monthly 2020-2023
- Hotel occupancy rate in Moscow 2023, by segment
- Average daily hotel rate in Moscow 2023, by segment
- Reasons to not travel long-haul in Russia 2022
- Intention to travel to Europe in Russia 2019-2022
- Summer vacation plans of Russians 2012-2023
- Travel frequency for private purposes in Russia 2023
- Average holiday spend per person in Russia 2011-2023
- Attitudes towards traveling in Russia 2023
- Travel product online bookings in Russia 2023
Other statistics that may interest you Travel and tourism in Russia
- Premium Statistic Countries with the highest outbound tourism expenditure worldwide 2019-2023
- Premium Statistic Travel industry revenue distribution in Russia 2022, by segment
- Premium Statistic Tourism spending in Russia 2019-2022, by travel purpose
- Basic Statistic Travel and tourism's total contribution to GDP in Russia 2019-2023
- Basic Statistic Travel and tourism's total contribution to employment in Russia 2019-2023
Outbound tourism
- Basic Statistic Outbound travel expenditure in Russia 2011-2022
- Premium Statistic Number of outbound tourism trips from Russia 2014-2022
- Premium Statistic Leading outbound travel destinations in Russia 2021-2022
- Premium Statistic Number of outbound tourists from Russia 2022, by territory
- Premium Statistic Outbound tourist flow growth in Russia 2022, by destination
- Premium Statistic European Union (EU) Schengen visas issued in Russia 2010-2023
Inbound and domestic tourism
- Basic Statistic International tourism spending in Russia 2011-2022
- Premium Statistic Leading source markets for travel to Russia 2020-2022, by arrivals
- Basic Statistic Domestic travel spending in Russia 2019-2022
- Basic Statistic Number of nature protected areas in Russia 2015-2022, by type
- Premium Statistic Estimated demand for inbound tourism in Russia Q1 2014-Q3 2023
- Premium Statistic Inbound tourist flow growth in Russia 2020-2023
- Premium Statistic Number of inbound tourist arrivals in Russia 2014-2022
Travel companies
- Premium Statistic Travel industry organizations distribution in Russia 2022, by segment
- Premium Statistic Number of tourism companies in Russia 2010-2022
- Premium Statistic Most popular travel websites in Russia 2023, by traffic
Package tours
- Premium Statistic Number of package tours sold in Russia 2014-2021, by type
- Premium Statistic Value of package tours sold in Russia 2014-2022, by type
- Premium Statistic Package tour cost in Russia 2014-2022, by type
- Premium Statistic Most popular travel destinations on package tours in Russia 2022
Transportation
- Premium Statistic Number of domestic airline passengers in Russia monthly 2020-2022
- Premium Statistic Passenger traffic growth of airlines in Russia 2021
- Premium Statistic Travel transportation consumer price in Russia 2022, by type
Accommodation
- Basic Statistic Paid travel accommodation services value in Russia 2015-2022
- Premium Statistic Travel accommodation establishments in Russia 2022, by federal district
- Basic Statistic Total room area in travel accommodation in Russia 2013-2022
- Premium Statistic Number of visitors in hotels in Russia 2010-2022
- Basic Statistic Number of hotel visitors in Russia 2022, by travel purpose
- Premium Statistic Overnight accommodation cost in Moscow monthly 2020-2023
- Premium Statistic Hotel occupancy rate in Moscow 2023, by segment
- Premium Statistic Average daily hotel rate in Moscow 2023, by segment
Travel behavior
- Premium Statistic Reasons to not travel long-haul in Russia 2022
- Premium Statistic Intention to travel to Europe in Russia 2019-2022
- Basic Statistic Summer vacation plans of Russians 2012-2023
- Premium Statistic Travel frequency for private purposes in Russia 2023
- Basic Statistic Average holiday spend per person in Russia 2011-2023
- Premium Statistic Attitudes towards traveling in Russia 2023
- Premium Statistic Travel product online bookings in Russia 2023
Further related statistics
- Premium Statistic Inbound tourist arrivals for personal purposes in Belarus 2010-2021
- Premium Statistic Inbound tourist arrivals for personal purposes in Azerbaijan 2010-2021
- Premium Statistic Number of inbound visits to the UK 2019-2022, by age group
- Premium Statistic Tourists from Asia in Spain 2016-2023, by origin
- Basic Statistic Number of Thailand residents traveling to Australia 2012-2014
- Premium Statistic Tourists from the Americas in Spain 2016-2023, by origin
- Basic Statistic Number of Chinese residents traveling to Australia 2012-2014
- Basic Statistic Non-resident Chinese visitor arrivals at national borders in the UK 2009-2018
- Premium Statistic Italy: number of Austrian tourist arrivals in 2015, by month
- Premium Statistic Inbound overnight tourist arrivals in Switzerland 2010-2018
- Premium Statistic Monthly tourist visits from Europe to the UK 2018-2023
- Basic Statistic Contribution to growth in tourist arrivals in Europe 2016-2020, by market
- Premium Statistic Inbound tourism volume in Norway 2010-2020
- Premium Statistic Number of inbound tourist arrivals in Belgium 2008-2020, by region
- Premium Statistic Visitor arrivals in Mallorca 2022, by place of residence
Further Content: You might find this interesting as well
- Inbound tourist arrivals for personal purposes in Belarus 2010-2021
- Inbound tourist arrivals for personal purposes in Azerbaijan 2010-2021
- Number of inbound visits to the UK 2019-2022, by age group
- Tourists from Asia in Spain 2016-2023, by origin
- Number of Thailand residents traveling to Australia 2012-2014
- Tourists from the Americas in Spain 2016-2023, by origin
- Number of Chinese residents traveling to Australia 2012-2014
- Non-resident Chinese visitor arrivals at national borders in the UK 2009-2018
- Italy: number of Austrian tourist arrivals in 2015, by month
- Inbound overnight tourist arrivals in Switzerland 2010-2018
- Monthly tourist visits from Europe to the UK 2018-2023
- Contribution to growth in tourist arrivals in Europe 2016-2020, by market
- Inbound tourism volume in Norway 2010-2020
- Number of inbound tourist arrivals in Belgium 2008-2020, by region
- Visitor arrivals in Mallorca 2022, by place of residence
IMAGES
VIDEO
COMMENTS
International Tourism and COVID-19. The pandemic generated a loss of 2.6 billion international arrivals in 2020, 2021 and 2022 combined; Export revenues from international tourism dropped 62% in 2020 and 59% in 2021, versus 2019 (real terms) and then rebounded in 2022, remaining 34% below pre-pandemic levels.
International tourism is expected to fully recover pre-pandemic levels in 2024, with initial estimates pointing to 2% growth above 2019 levels. This central forecast by UNWTO remains subject to the pace of recovery in Asia and to the evolution of existing economic and geopolitical downside risks. The positive outlook is reflected in the latest ...
According to the first UNWTO World Tourism Barometer of the year, international tourism ended 2023 at 88% of pre-pandemic levels, with an estimated 1.3 billion international arrivals.The unleashing of remaining pent-up demand, increased air connectivity, and a stronger recovery of Asian markets and destinations, are expected to underpin a full recovery by the end of 2024 (UNWTO Tourism ...
After Covid-19 had made 2020 "the worst year in tourism history", international tourist arrivals increased by just 13 percent in 2021, as travel restrictions remained in place for long periods in ...
Accurate forecasting of international tourist arrivals plays an important role in tourism planning and management as it provides the basis for appropriate policy decisions and infrastructure development. In this paper, we developed forecasting models for total international arrivals and international arrivals in Sri Lanka from 10 major source ...
International tourism growth continues to outpace the global economy. All Regions. 20 Jan 2020. 1.5 billion international tourist arrivals were recorded in 2019, globally. A 4% increase on the previous year which is also forecast for 2020, confirming tourism as a leading and resilient economic sector, especially in view of current uncertainties.
An estimated 700 million tourists travelled internationally between January and July 2023, about 43% more than in the same months of 2022, though 16% fewer than in 2019. By regions, the Middle East saw the best results in January-July 2023, with arrivals exceeding by 20% pre-pandemic levels. Europe, the world's largest destination region ...
International tourism reached 97% of pre-pandemic levels in the first quarter of 2024 International arrivals (overnight visitors) reached 97% of 2019 levels in the first quarter of 2024, reflecting an almost complete recovery of pre-pandemic numbers. An estimated 285 million tourists travelled internationally in the first three months of 2024, about 20% more than in the same period of 2023 ...
Number of international tourist arrivals APAC 2019, by country or region Middle Eastern countries with the largest international tourism receipts 2018 Music tourist spending at concerts and ...
International tourist arrivals worldwide were around 95,000 at the beginning of 2019. The growth rate of tourist arrivals was slower. ... Forecasts predict that international tourist arrivals will hit 1.5 billion, representing a rapid 17.23% increase compared to estimates from 2023. This surge will elevate volumes well beyond pre-pandemic levels.
1383.70. May/24. 1700. 1600. 1600. 1700. Thousand. Trading Economics provides data for 20 million economic indicators from 196 countries including actual values, consensus figures, forecasts, historical time series and news. Tourist Arrivals Forecast 2024/2025 - was last updated on Saturday, June 15, 2024.
without any forecasting of international tourist arrivals. This often leads to failure in achieving the targets because they are too ambitious (Fernando, 2016). The main motivation of this paper is to demonstrate the role that accurate forecasting of international tourist arrivals can play in formulating tourism strategies and plans in developing
In Africa and Zimbabwe in particular, statistical time-series tourist prediction models are lacking. More wealthy nations than emerging ones use the models. The lack of scientific methodologies and informative time series models for forecasting international visitor arrivals for planning and decision-making purposes is being filled.
National Travel and Tourism Office Forecast of International Visitation to the United States by Top Origin Countries (February 2023) Table 1: Volume (Estimate in Thousands) ... Source: U.S. Department of Commerce, International Trade Administration, Industry & Analysis, National Travel and Tourism Office; Statistics Canada; INEGI. Actual Forecast
Revenue analytics and forecasts Explore eCommerce Insights ... International tourist arrivals worldwide 2019-2022, by subregion; Travel and tourism's total contribution to GDP in Europe 2019-2034;
This paper proposes and compares forecasting models for international tourism arrivals to Thailand. Since country-specific forecasting models can reflect the uniqueness of each country of origin, major countries for Thai tourism, namely China, Malaysia, Korea, Japan, and Russia are explored.
The significance of tourism has encouraged the authors to study the number of international tourist arrivals and attempt to make more accurate forecasting for future planning. Zambia's tourist attraction includes 20 National Parks and 34 Game Management Areas (GMAs) with a total of 23 million hectares of land devoted to spectacular wildlife.
The second UNWTO World Tourism Barometer of the year shows that the sector's swift recovery has continued into 2023. It shows that: Overall, international arrivals reached 80% of pre-pandemic levels in the first quarter of 2023. An estimated 235 million tourists travelled internationally in the first three months, more than double the same ...
As world tourism rebounds, South Africa is seeing a similar trend. In 2021, the number of international tourist arrivals (overnight visitors) was 77,9% lower than the pre-pandemic levels of 2019, declining from 10,23 million tourists in 2019 to 2,26 in 2021. In 2022, there was a slight recovery in the number of tourists (approximately 5,70 ...
Australia's top source of tourists before COVID, China is now number four, with arrivals down 53% in March from March 2019, said Margy Osmond, chief executive of Tourism & Transport Forum Australia.
Indeed, the tourism sector accounted for 8.5% of its gross domestic product in 2023, according to Statistics Iceland, citing preliminary figures of the Tourism Satellite Accounts. That's up from 7 ...
According to the latest UNWTO World Tourism Barometer, international tourist arrivals almost tripled in January to July 2022 (+172%) compared to the same period of 2021. This means t he sector recovered almost 60% of pre-pandemic levels. The steady recovery reflects strong pent-up demand for international travel as well as the easing or lifting ...
Number of international tourist arrivals in India 2010-2021 Change in number of visitors from Mexico to the U.S. 2018-2024 Passenger traffic at Dubai Airports from 2010 to 2020*
Putin has been in power in Russia, either as President or Prime Minister, for almost a quarter century, but his arrival in North Korea tomorrow will mark just the second visit to the country since ...
Published June 16, 2024, 3:01 p.m. ET. If you thought the Cold War had returned last week, you were not daydreaming. The Kazan, a Russian nuclear-powered submarine, and accompanying surface ships ...
"The flight later departed from ATH, arriving in DOH at 10.39 local time on Tuesday 11 June 2024, where we extended our full support to all affected passengers upon arrival to ensure smooth ...
For 2019, UNWTO forecasts a 3-4% increase, in line with the historical growth trend; Madrid, Spain, 21 January 2019 - International tourist arrivals grew 6% in 2018, totalling 1.4 billion according to the latest UNWTO World Tourism Barometer. UNWTO's long term forecast issued in 2010 indicated the 1.4 billion mark would be reached in 2020 ...
NEEDHAM, Mass., March 6, 2024 - As the global economy nears recovery, so will the PC market with global shipments forecast to reach 265.4 million units in 2024, up 2.0% from the prior year according to the International Data Corporation Worldwide Quarterly Personal Computing Device Tracker.While vendors focused on clearing inventory in 2023, IDC expects 2024 to be an expansion year with the ...
The agency also projects the country's debt to fall below 60% by 2027, thanks to strong fiscal surpluses averaging 2.1% of GDP over the next three years, "our strongest forecast across all 20 ...
Non-resident Chinese visitor arrivals at national borders in the UK 2009-2018; Italy: number of Austrian tourist arrivals in 2015, by month; Inbound overnight tourist arrivals in Switzerland 2010-2018